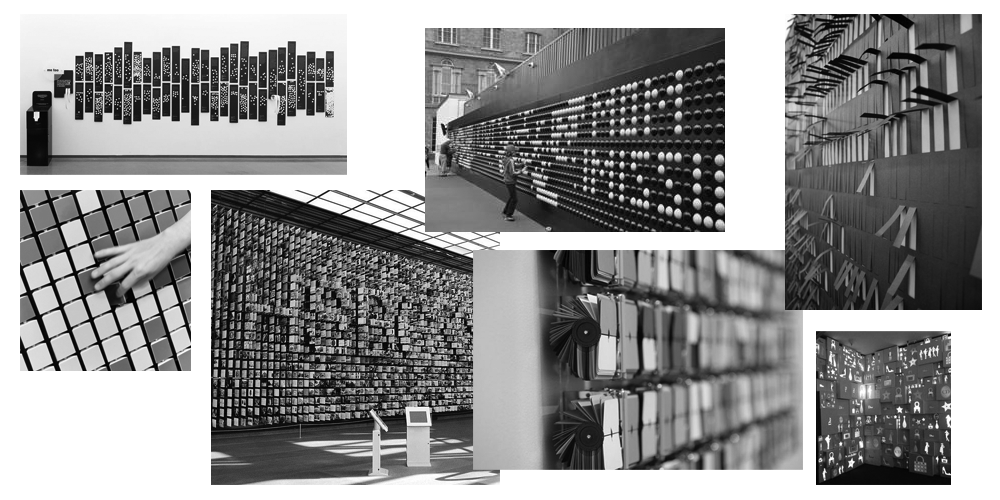
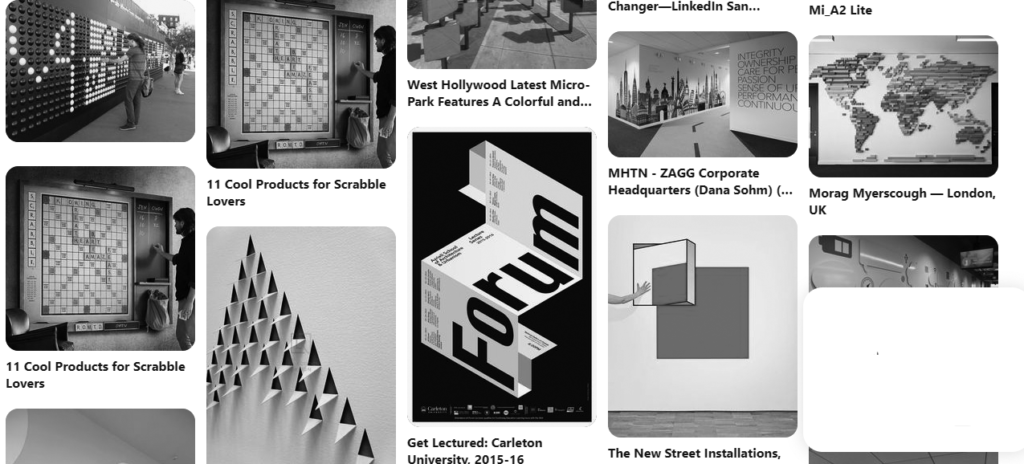
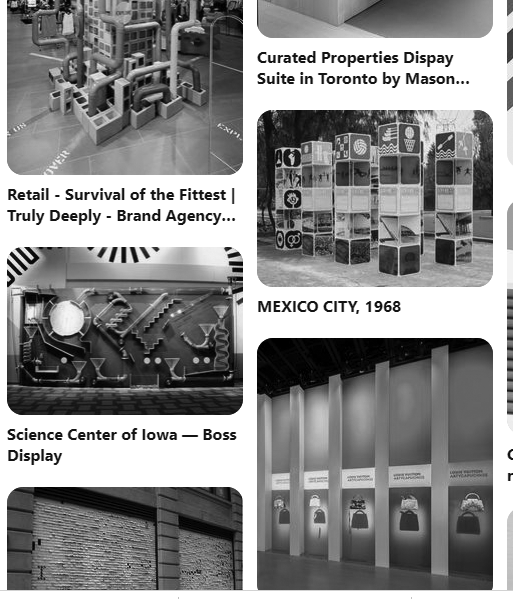
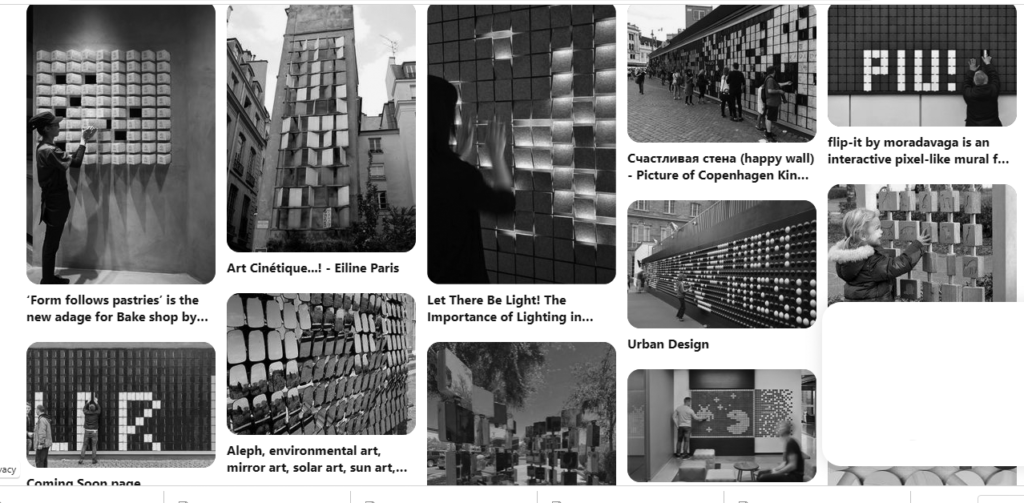
Nowadays, data is generally presented via a dashboard… via graphs and other modes of digital visualisation. What happens when this experience becomes physical. What can the ‘physical and tangible’ add to the data experience? What is the essence of the data physicalisation that will take the data experience to a new level? We are really trying to immerse ourselves in this ‘physical’ data phenomenon. Hence, we are back on google searching for inspiration. Take a look at some of the VERY exciting work that we have come across.
(Disclaimer: No copyright infringement intended and we are happy to remove any material that you feel constitutes a copyright infringement).


0 Comments